TABLE
Sets specific variables with the coordinates and sizes of rows and columns of a table.
Syntax
TABLE [ x:measureValue ] [ y:measureValue ] [ w:measureValue ] [ h:measureValue ]
    cols:intValue rows:intValue
    [ w1:Width ] ... [ wn:Width ]
    [ h1:Height ] ... [ hm:Height ] .

Width : measureValue | realValue | Percentage .

Height : measureValue | realValue | Percentage .
Parameters
x(measureValue, optional) - The x-coordinate of the top-left corner for the table. The default is0cm.y(measureValue, optional) - The y-coordinate of the top-left corner for the table. The default is0cm.w(measureValue, optional) - The width for the table. The default is0cm.h(measureValue, optional) - The height for the table. The default is0cm.cols(intValue) - The amount of columns the table has.rows(intValue) - The amount of rows the table has.w<intValue>(Width, optional) - The width of the n-th column where n-th is specified through<intValue>. It is specified either as an fixedmeasureValueor a variable size through arealValueorPercentagevalue. The default is the variable size value1.0.h<intValue>(Height, optional) - The height of the n-th row where n-th is specified through<intValue>. It is specified either as an fixedmeasureValueor a variable size through arealValueorPercentagevalue. The default is the variable size value1.0.
Returns
tabx<intValue>(measureValue) - The x-coordinate of the left border line of the column<intValue> + 1or the right border line if<intValue>is the same ascols. The<intValue>can be from0to the value ofcols.taby<intValue>(measureValue) - The y-coordinate of the top border line of the row<intValue> + 1or the bottom border line if<intValue>is the same asrows. The<intValue>can be from0to the value ofrows.tabw<intValue>(measureValue) - The width of the column<intValue>. The<intValue>can be from1to the value ofcols.tabh<intValue>(measureValue) - The height of the row<intValue>. The<intValue>can be from1to the value ofrows.
The following image visualizes the coordinates for a table with two columns and three rows.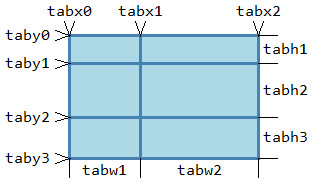
Details
The TABLE command does not draw anything on its own, instead it sets specific variables (see returns section) which can then be used with other commands like RECTANGLE, ROUNDRECT, LINE to draw a shape.
It is typically used for re-sizeable objects. A table consists of columns and rows which each have either a fixed or a variable width or height. Variable widths or heights change when the object's size is changed. The sizes calculated are assigned to runtime variables which other commands below can access. The default position of the table is specified the x and y parameters for its top-left coordinate and its default size through the w and h parameters.
A table defines a rectangular area divided into a fixed number of columns (cols) and rows (rows). The parameters for the column widths of a table of n columns bear the names w1 to wn. Similarly, the parameters for the row heights for m rows are named h1 to hm. If you wish to specify a fixed column width or line height then specify a measureValue, like w1:0.2cm or h2:(0.6cm + 0.7cm). It is not possible to use variables for specifying the width of columns or height of rows. For variable sizes, an amount as a realValue like w1:0.5 or as a percentage like w1:50% can be specified instead. This amount refers to the rest of the available space after the fixed sizes have been subtracted. The variable sizes for columns and for rows should add up to 1.0 or more each. Otherwise only part of the table's real space will be used by the columns / rows. When the variable sizes of columns / rows add up to more than 1.0 then the space is distributed based on their ratio.
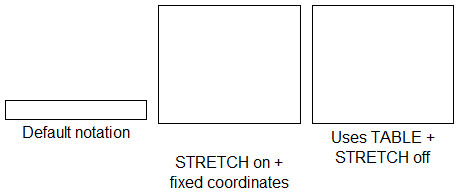
Usually, a TABLE command is used to have certain fixed points in a notation that is re-sizable and prevent them from moving then the object is resized. It is typically followed by a STRETCH off, to avoid double stretching of the elements. It helps with solving the issue of changing certain distances in a notation that should stay the same.
Consider the three objects in the following image, each of them being a rectangle with a text below it. The left most is the default size and look of the object, with the text starting roughly 0.1cm below the rectangle. The middle version specifies fixed coordinates for the rectangle and the text and has STRETCH on and shows that the text has moved further away from the rectangle and this distance increases with the height of the object. The right version uses instead a table, switches STRETCH off and both the rectangle and text use positions provided by the table. In the last case the text has still the same distance to the rectangle, even after resizing the entire object.
Code for above example
The following GraphRep code has been used to create the above image. It requires the class to have an attribute "Use table" that can be set to the value "yes" (like a short string or an enumeration).
GRAPHREP height-sizing:asymmetrical smart-symbol-size
SHADOW off

AVAL sUseTable:"Use table"
IF (sUseTable = "yes") {
  TABLE w:3cm h:0.4cm cols:1 rows:1
  STRETCH off
  RECTANGLE x:(tabx0) y:(taby0) w:(tabw1) h:(tabh1)
  ATTR "Name" x:(tabx0 + (tabw1/2)) y:(taby1+0.1cm) w:c:(tabw1) h:t line-break:words
} ELSE {
  RECTANGLE w:3cm h:0.4cm
  ATTR "Name" x:1.5cm y:0.5cm w:c:3cm h:t line-break:words
}
When defining resizable notations it is advised to use the parameter smart-symbol-size wherever possible. This makes the definition of a symbol with both flexible and fixed parts much easier.
See Also
Examples
Draw a rectangle with a vertical and a horizontal line inside of it. The object should be asymmetrically resizable. The vertical line should be at the fixed distance of 1.3cm from the left. The horizontal line should split the rectangle with an 4 to 6 ratio (40% above and 60% below).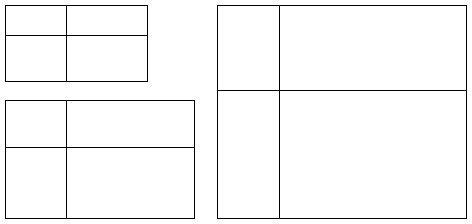
GRAPHREP sizing:asymmetrical
SHADOW off

TABLE w:3cm h:1.6cm cols:2 rows:2
  w1:1.3cm w2:100%
  h1:40% h2:0.6
STRETCH off

RECTANGLE x:(tabx0) y:(taby0) w:(tabw1 + tabw2) h:(tabh1 + tabh2)
LINE x1:(tabx0) y1:(taby1) x2:(tabx2) y2:(taby1)
LINE x1:(tabx1) y1:(taby0) x2:(tabx1) y2:(taby2)
Draw a table using the TABLE command and visualize the variables set by it.
GRAPHREP sizing:asymmetrical smart-symbol-size
SHADOW off

TABLE w:4cm h:2.6cm cols:2 rows:3
  w1:1.5cm w2:100%
  h1:0.3 h2:0.5 h3:0.4
STRETCH off

PEN w:2pt color:"steelblue"
FILL color:"lightblue"
RECTANGLE x:(tabx0) y:(taby0) w:(tabw1 + tabw2) h:(tabh1 + tabh2 + tabh3)
LINE x1:(tabx0) y1:(taby1) x2:(tabx2) y2:(taby1)
LINE x1:(tabx0) y1:(taby2) x2:(tabx2) y2:(taby2)
LINE x1:(tabx1) y1:(taby0) x2:(tabx1) y2:(taby3)

PEN
FONT "Consolas"

# Horizontal coordinate markers
SET dXO:(0.1cm) dYO:(0.3cm)
SET dX:(tabx0) dY:(taby0)
POLYLINE ({dX-dXO, dY-dYO, dX, dY, dX+dXO, dY-dYO})
TEXT "tabx0" x:(dX) y:(dY-dYO) w:c h:b
SET dX:(tabx1) dY:(taby0)
POLYLINE ({dX-dXO, dY-dYO, dX, dY, dX+dXO, dY-dYO})
TEXT "tabx1" x:(dX) y:(dY-dYO) w:c h:b
SET dX:(tabx2) dY:(taby0)
POLYLINE ({dX-dXO, dY-dYO, dX, dY, dX+dXO, dY-dYO})
TEXT "tabx2" x:(dX) y:(dY-dYO) w:c h:b

# Width markers
SET dY:(taby3) dYO:(0.4cm)
SET dX:(tabx0) dW:(tabw1)
LINE x1:(dX) y1:(dY) x2:(dX) y2:(dY+dYO)
TEXT "tabw1" x:(dX+(dW/2)) y:(dY+0.05cm) w:c h:t
SET dX:(tabx1) dW:(tabw2)
LINE x1:(dX) y1:(dY) x2:(dX) y2:(dY+dYO)
TEXT "tabw2" x:(dX+(dW/2)) y:(dY+0.05cm) w:c h:t
SET dX:(tabx2)
LINE x1:(dX) y1:(dY) x2:(dX) y2:(dY+dYO)

# Vertical coordinate markers
SET dXO:(0.3cm) dYO:(0.1cm)
SET dX:(tabx0) dY:(taby0)
POLYLINE ({dX-dXO, dY-dYO, dX, dY, dX-dXO, dY+dYO})
TEXT "taby0" x:(dX-dXO-0.1cm) y:(dY) w:r h:c
SET dX:(tabx0) dY:(taby1)
POLYLINE ({dX-dXO, dY-dYO, dX, dY, dX-dXO, dY+dYO})
TEXT "taby1" x:(dX-dXO-0.1cm) y:(dY) w:r h:c
SET dX:(tabx0) dY:(taby2)
POLYLINE ({dX-dXO, dY-dYO, dX, dY, dX-dXO, dY+dYO})
TEXT "taby2" x:(dX-dXO-0.1cm) y:(dY) w:r h:c
SET dX:(tabx0) dY:(taby3)
POLYLINE ({dX-dXO, dY-dYO, dX, dY, dX-dXO, dY+dYO})
TEXT "taby3" x:(dX-dXO-0.1cm) y:(dY) w:r h:c

# Height markers
SET dX:(tabx2) dXO:(0.4cm)
SET dY:(taby0) dH:(tabh1)
LINE x1:(dX) y1:(dY) x2:(dX+dXO) y2:(dY)
TEXT "tabh1" x:(dX+0.1cm) y:(dY+(dH/2)) w:l h:c
SET dY:(taby1) dH:(tabh2)
LINE x1:(dX) y1:(dY) x2:(dX+dXO) y2:(dY)
TEXT "tabh2" x:(dX+0.1cm) y:(dY+(dH/2)) w:l h:c
SET dY:(taby2) dH:(tabh3)
LINE x1:(dX) y1:(dY) x2:(dX+dXO) y2:(dY)
TEXT "tabh3" x:(dX+0.1cm) y:(dY+(dH/2)) w:l h:c
SET dY:(taby3)
LINE x1:(dX) y1:(dY) x2:(dX+dXO) y2:(dY)
Versions and Changes
Available since ADOxx 1.3